The concept of harmonic patterns in technical analysis has a rich history, characterized by significant contributions and developments over the years.
Origin
Harmonic patterns in trading emerged from the discovery that price movements in financial markets often follow certain geometric patterns, which can be predicted and analyzed using Fibonacci ratios. These patterns reflect the natural ebb and flow of market psychology and sentiment, following a rhythm that can be deciphered and leveraged in trading strategies.
Key Milestones:
- H.M. Gartley: In the 1930s, H.M. Gartley first introduced these concepts in his book “Profits in the Stock Market.” His pattern, known as the Gartley pattern, laid the foundation for future harmonic patterns.
- Larry Pesavento: Later, Larry Pesavento expanded on Gartley’s work by applying Fibonacci numbers to these patterns, creating more precise trading strategies.
- Scott Carney: A significant leap in harmonic trading came with Scott Carney, who further refined the patterns in the 1990s, particularly with the introduction of the Bat pattern and enhancements to the Gartley pattern.
These developments over the years have made harmonic patterns a crucial part of technical analysis, helping traders to identify potential reversals in the market with a higher degree of accuracy.
Why Do Harmonic Patterns Matter?
Harmonic patterns are essential in trading because they are excellent tools for predicting when and where the market might reverse. These patterns are based on specific, repeating price movements that often align with critical Fibonacci ratios — a series of numbers found frequently in nature and financial markets. This alignment allows traders to anticipate potential turning points with a significant degree of accuracy.
Moreover, harmonic patterns reflect underlying market psychology, capturing the collective behavior of traders who often react in predictable ways at certain price levels. This aspect is crucial as it helps traders understand and anticipate market sentiment, providing valuable insights for making informed trading decisions.
Basics of Harmonic Patterns
Harmonic patterns in trading are based on the principle that price movements often follow a natural rhythm that can be identified and predicted using geometric structures and Fibonacci ratios. At their core, these patterns represent price structures that consist of consecutive and interconnected retracement and extension waves.
Key Components
- Fibonacci Ratios: Central to these patterns are Fibonacci ratios like 61.8%, 38.2%, and 78.6%. These ratios help in identifying potential reversal points in the price movements. Each harmonic pattern has a distinct set of Fibonacci levels that define its structure.
- Price Legs: Harmonic patterns are made up of multiple ‘legs’ or price movements. These legs are named as XA, AB, BC, and CD, and each leg represents a particular move in the market, either upward or downward. The relationship between these legs, in terms of their length and the time taken to form, is critical in defining a valid harmonic pattern.
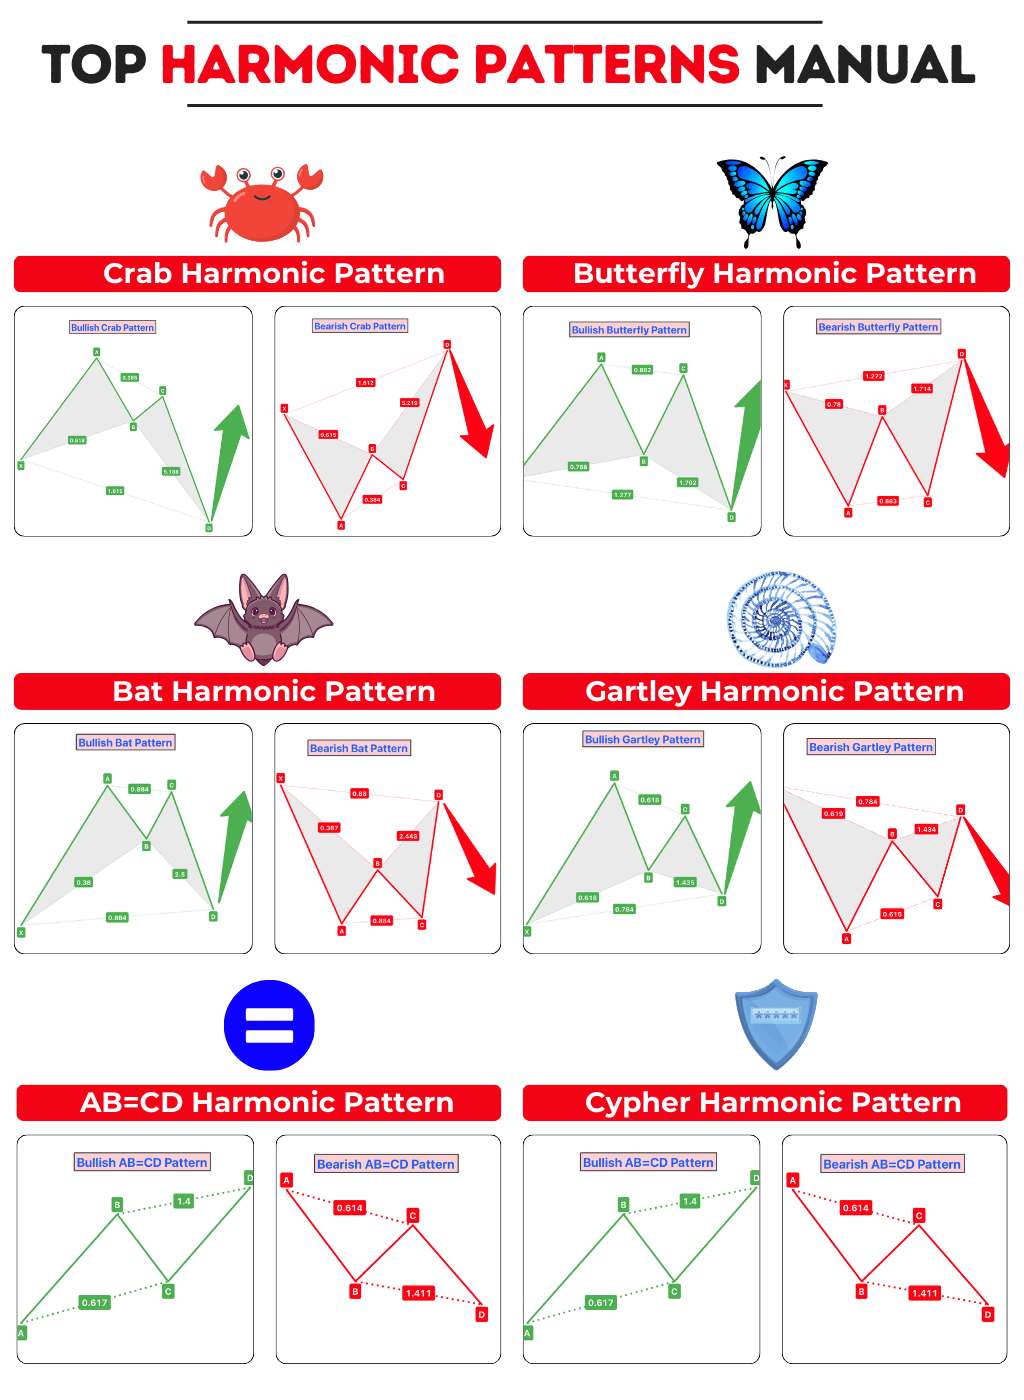
Types of Harmonic Patterns
Harmonic patterns are key tools in technical analysis, each with its distinct structure and Fibonacci ratios. These patterns can be bullish, indicating potential upward reversals, or bearish, suggesting downward reversals. Here’s a brief overview of some major harmonic patterns:
| Harmonic Pattern | Bullish Nature | Bearish Nature | Description |
|---|---|---|---|
| Gartley Pattern | ‘W’ shaped | ‘M’ shaped | Known for precise Fibonacci ratios, particularly a 61.8% retracement of the XA leg in the AB leg. |
| Bat Pattern | Deep XA retracement | Deep XA retracement | Characterized by an 88.6% retracement of the XA leg in the CD leg, signaling precise reversal points. |
| Butterfly Pattern | Extended CD leg | Extended CD leg | Features a 78.6% retracement of the XA leg in the AB leg and an extended CD leg up to 161.8%. |
| Crab Pattern | Extremely steep retracement | Extremely steep retracement | Known for its extreme projections and retracements, with the CD leg extending up to 161.8% of the XA leg. |
| Cypher Pattern | Less stringent Fibonacci ratios | Less stringent Fibonacci ratios | A newer pattern with a 38.2% to 61.8% retracement in the AB leg and a 127.2% to 141.4% extension in the CD leg. |
| AB=CD Pattern | Equal legs | Equal legs | Simple and reliable, marked by equal AB and CD legs with complementary retracement and extension ratios. |
In bullish variations, these patterns typically form during a downtrend and suggest a potential upward reversal. Conversely, in bearish variations, they appear during uptrends and hint at a downward reversal.
List of 5 major harmonic patterns
Here’s the explanation of each harmonic pattern, along with the trend and signal generated by each pattern. i have explained almost all the major harmoic patterns.
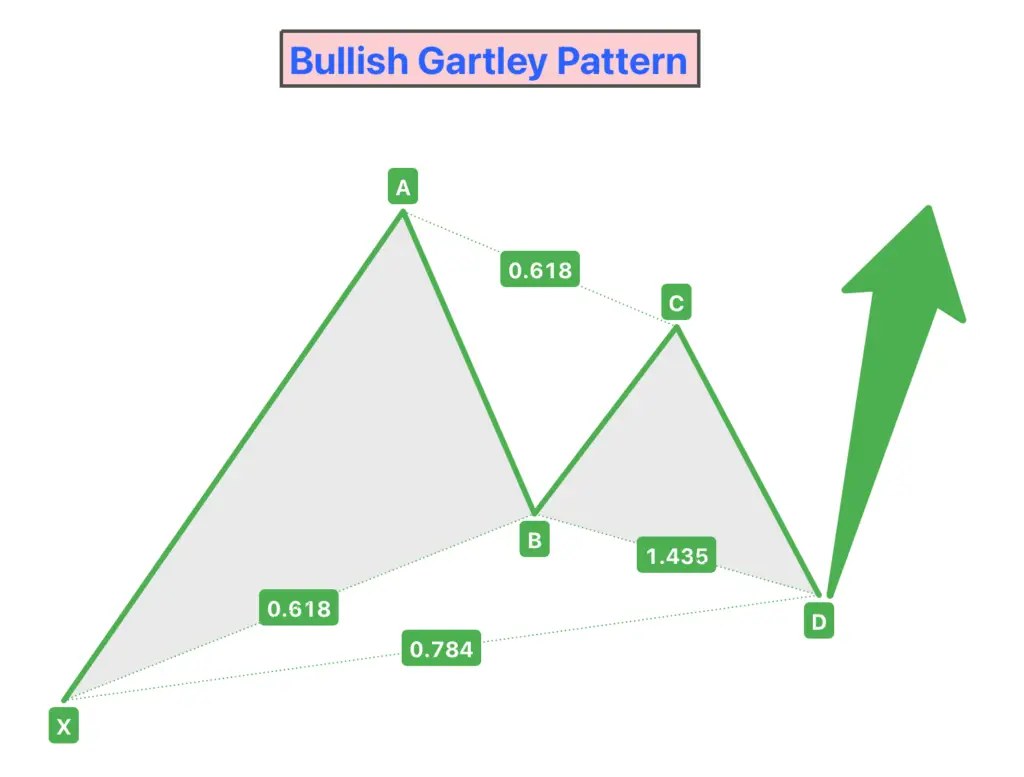
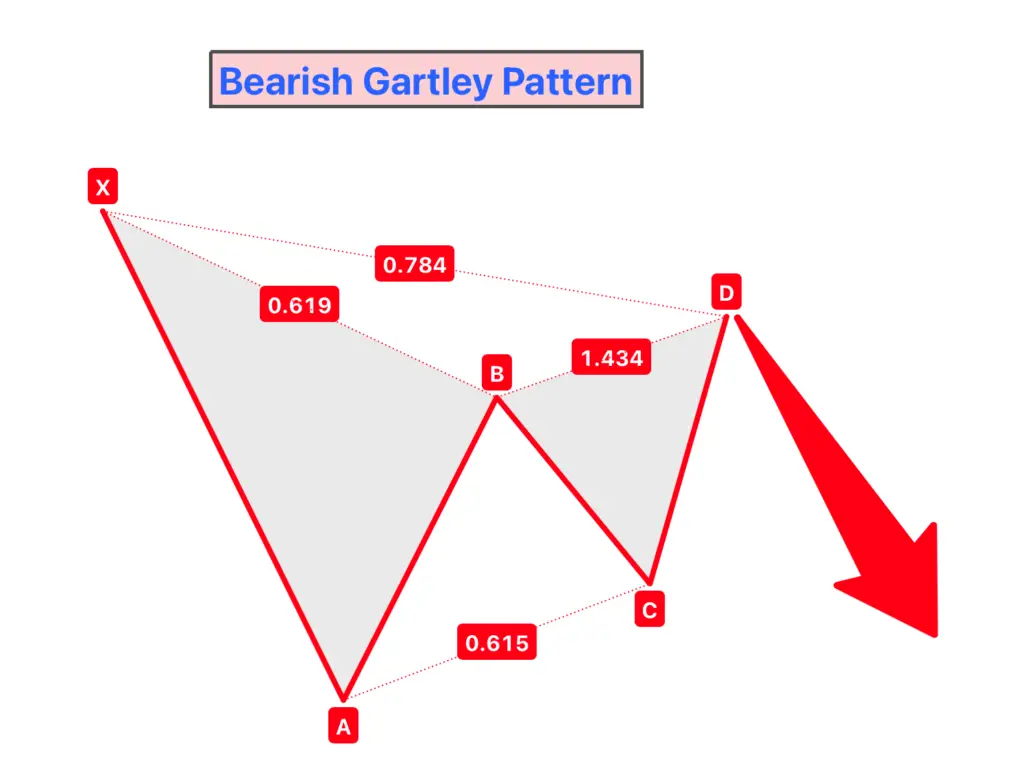
1. Gartley Pattern
Definition
The Gartley Pattern is a harmonic chart pattern, recognized by its distinct ‘M’ or ‘W’ shape. It was first introduced by H.M. Gartley in his book “Profits in the Stock Market.”
Signal
- Bullish Signal: A ‘W’-shaped Gartley Pattern, typically found at the bottom of downtrends, indicates a potential bullish reversal.
- Bearish Signal: An ‘M’-shaped Gartley Pattern, appearing at the top of uptrends, suggests a potential bearish reversal.
Fibonacci Ratios
- XA Leg: No specific Fibonacci ratio.
- AB Leg: Retraces 61.8% of the XA leg.
- BC Leg: Retraces 38.2% to 88.6% of the AB leg.
- CD Leg: Extends 127.2% to 161.8% of the BC leg and also retraces 78.6% of the XA leg.
Trend
- The Gartley Pattern can be observed in both bullish and bearish market trends:
- In Bullish Trends: It helps identify exhaustion points in a downtrend, signaling potential upward reversals.
- In Bearish Trends: It indicates possible reversal points in an uptrend, signaling downward movements.
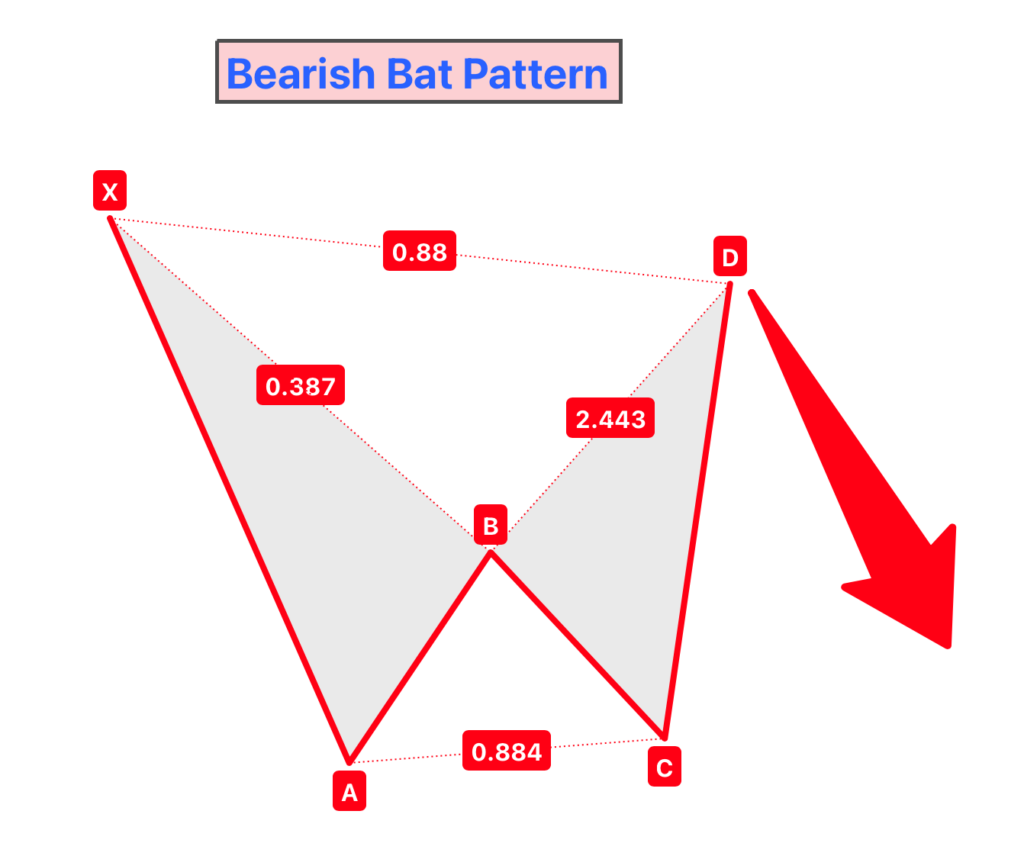
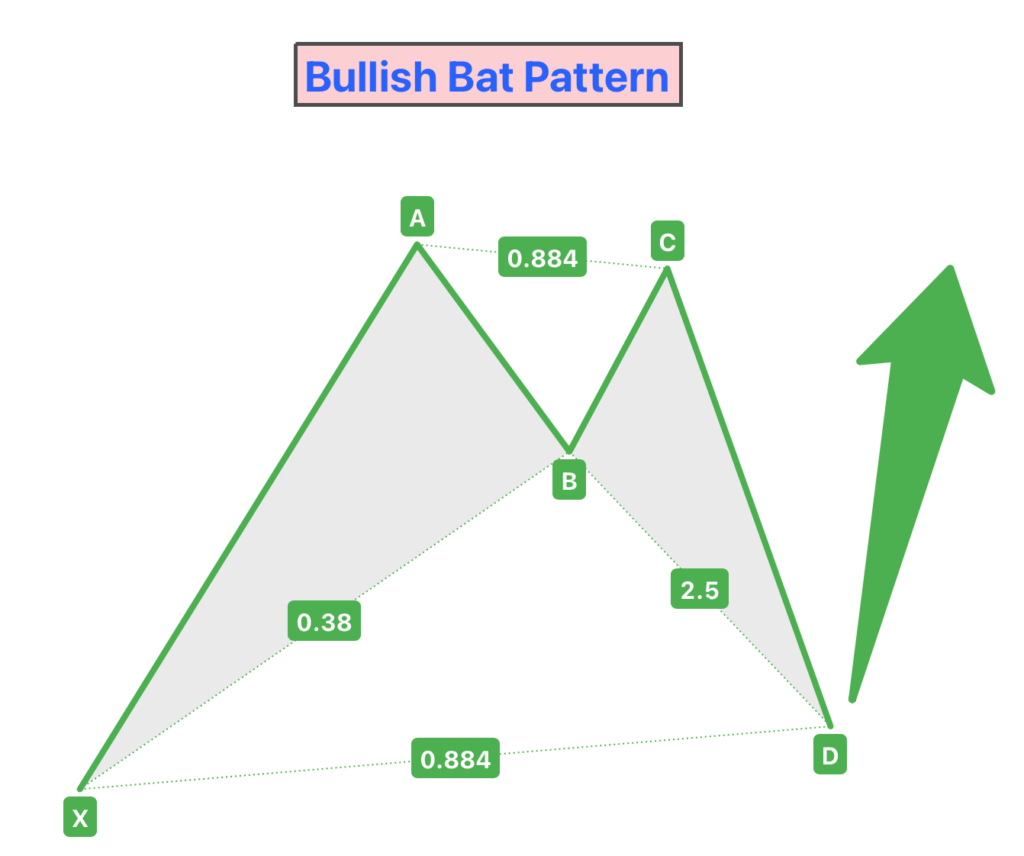
2. Bat Pattern
Definition
The Bat Pattern is an advanced harmonic chart pattern known for its high precision in identifying market reversals. It is characterized by distinct proportions and alignments based on Fibonacci ratios.
Signal
- Bullish Signal: This occurs when the pattern is identified at the end of a downtrend, forming a shape similar to a ‘W’. It suggests a potential upward reversal in the market.
- Bearish Signal: In uptrends, the pattern resembles an ‘M’ and indicates a potential downward reversal.
Fibonacci Ratios
- XA Leg: No specific Fibonacci ratio required.
- AB Leg: Retraces to 38.2% or 50% of the XA leg.
- BC Leg: Retraces from 38.2% to 88.6% of the AB leg.
- CD Leg: Extends to 88.6% of the XA leg and often retraces 161.8% to 261.8% of the BC leg.
Trend
- The Bat Pattern can emerge in both bullish and bearish market conditions:
- In Bullish Trends: It is typically found at the bottom of downtrends, serving as an indicator for a potential shift to an uptrend.
- In Bearish Trends: Appears at the peak of uptrends, suggesting a shift towards a downtrend.
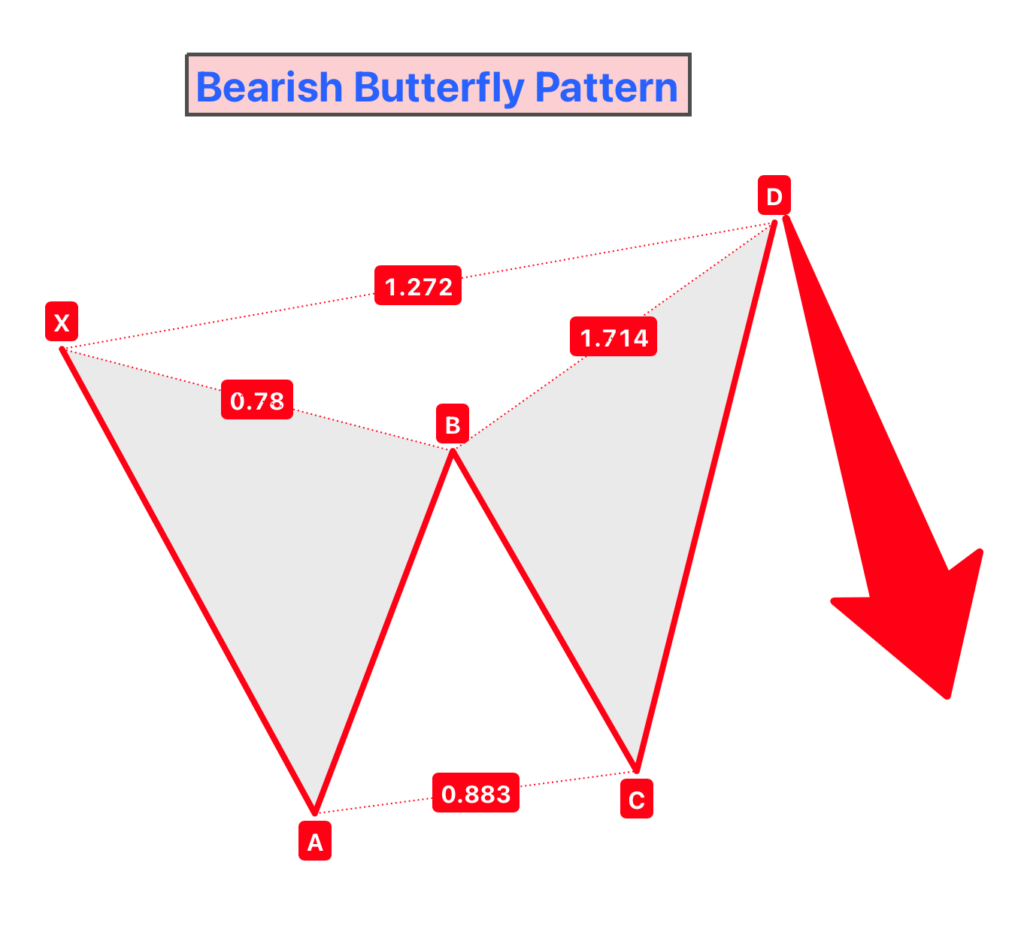
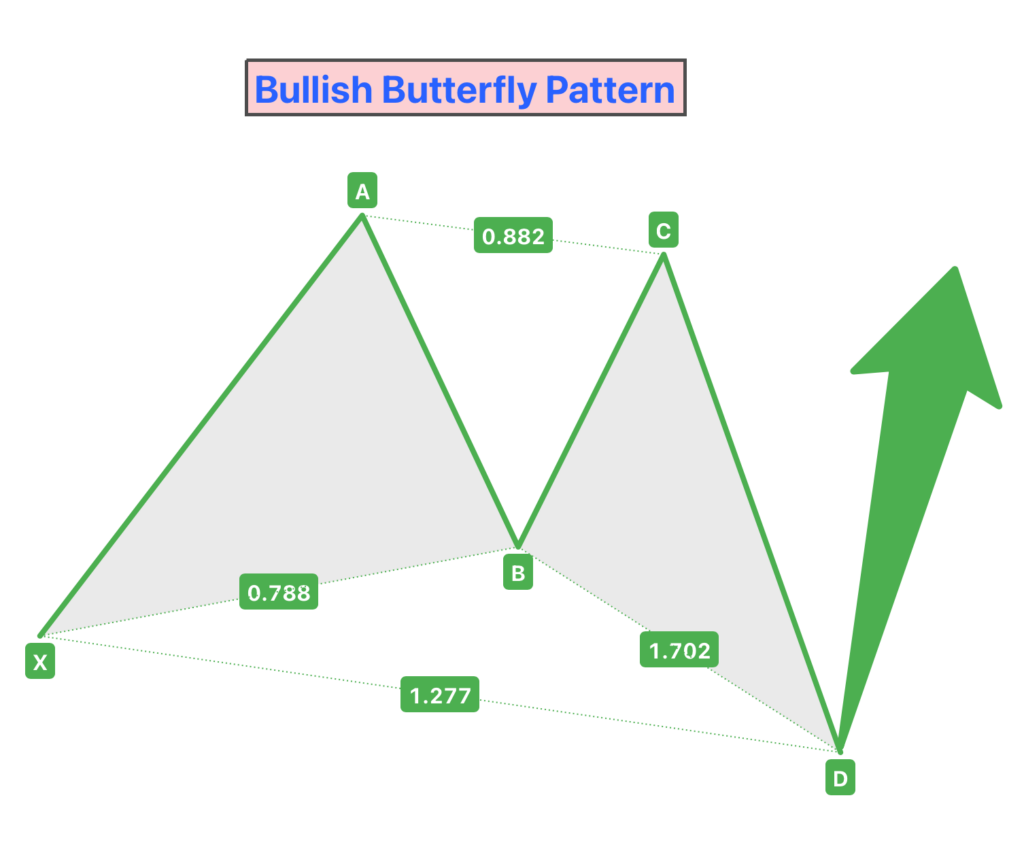
3. Butterfly Pattern
Definition
The Butterfly Pattern is a distinctive harmonic chart pattern recognized for its unique structure and Fibonacci ratio alignments. It is often used to pinpoint potential reversal points at the end of an extended price move.
Signal
- Bullish Signal: Appears at the end of a downtrend and is characterized by a distinct ‘W’ shape, indicating a potential upward reversal.
- Bearish Signal: Forms at the top of an uptrend, resembling an ‘M’ shape, and suggests a potential downward reversal.
Fibonacci Ratios
- XA Leg: Initiates the pattern without a specific Fibonacci requirement.
- AB Leg: Retraces to 78.6% of the XA leg.
- BC Leg: Can retrace between 38.2% and 88.6% of the AB leg.
- CD Leg: Extends to 161.8% to 261.8% of the AB leg and also typically retraces 127.2% to 161.8% of the XA leg.
Trend
- The Butterfly Pattern is versatile, appearing in both bullish and bearish contexts:
- In Bullish Trends: It is identified at the low points of downtrends, offering signals for a potential upward market reversal.
- In Bearish Trends: Emerges at the high points of uptrends, providing indications for potential bearish reversals.
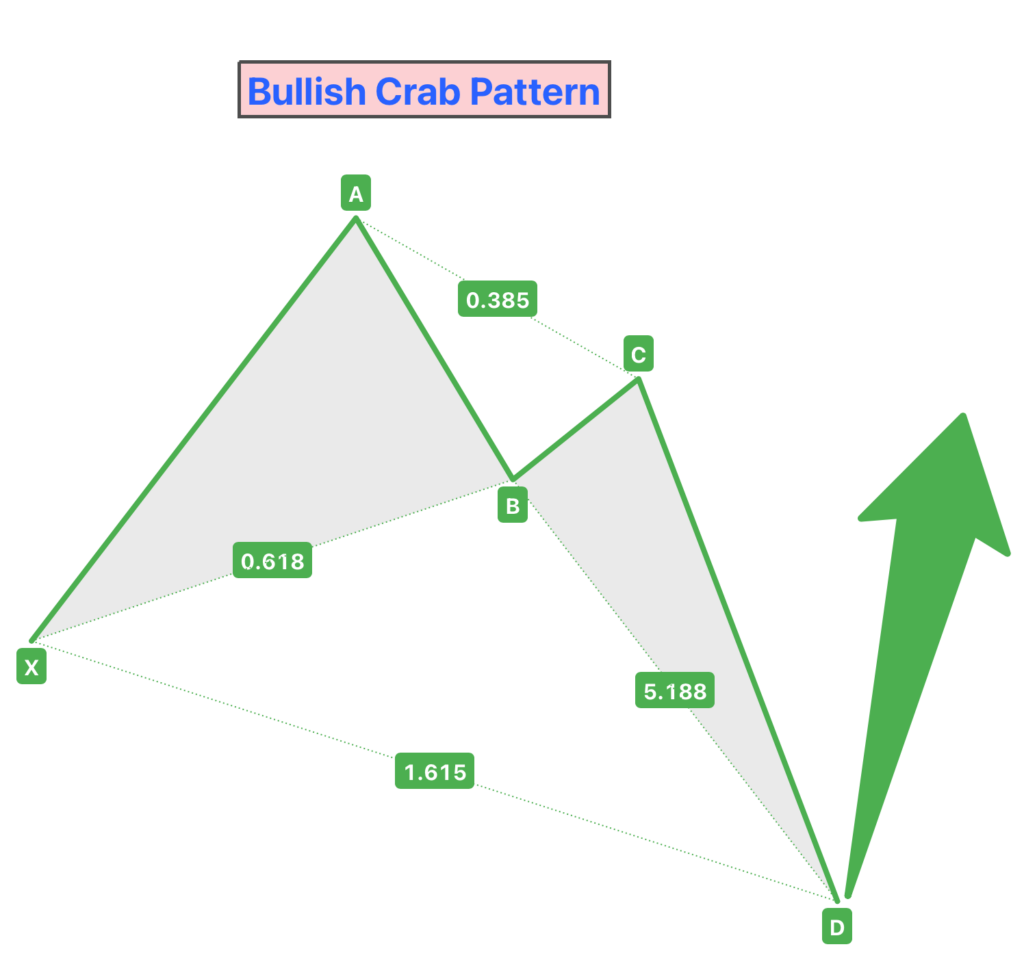
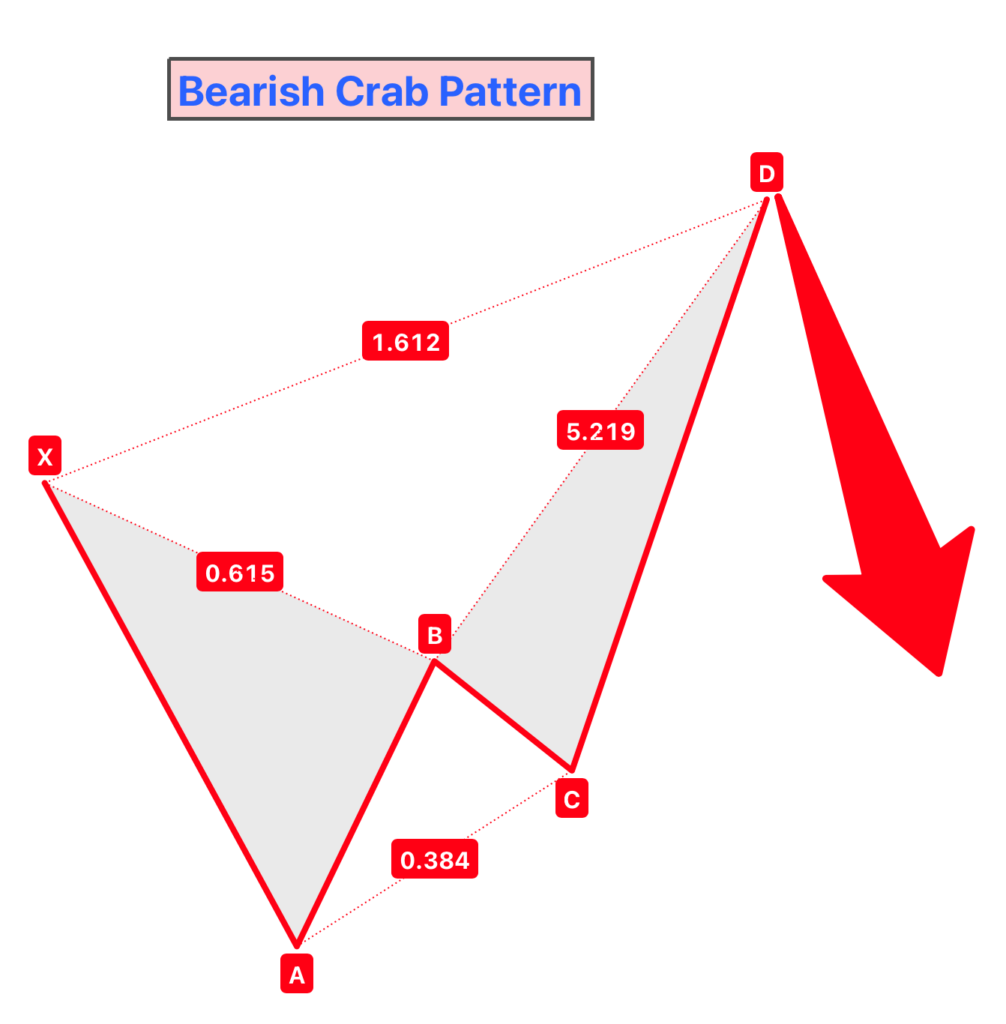
4. Crab Pattern
Definition
The Crab Pattern is a harmonic chart pattern recognized for its extreme projections and retracements. It is considered one of the most precise patterns within the harmonic pattern family due to its specific and stringent Fibonacci ratios.
Signal
- Bullish Signal: This pattern appears at the end of a downtrend, forming a distinct ‘W’ shape, and signals a potential upward reversal in the market.
- Bearish Signal: In uptrends, it creates an ‘M’ shape at the top and suggests a potential downward reversal.
Fibonacci Ratios
- XA Leg: Begins the pattern without a specific Fibonacci requirement.
- AB Leg: Retraces typically to 38.2% or 61.8% of the XA leg.
- BC Leg: Can retrace anywhere from 38.2% to 88.6% of the AB leg.
- CD Leg: Notably extends to 161.8% or even up to 261.8% of the XA leg and also retraces 224% of the BC leg.
Trend
- The Crab Pattern can be observed in both bullish and bearish market trends:
- In Bullish Trends: It is usually found at the bottom of downtrends, indicating potential reversals to the upside.
- In Bearish Trends: Forms at the top of uptrends, hinting at potential shifts to downward movements.
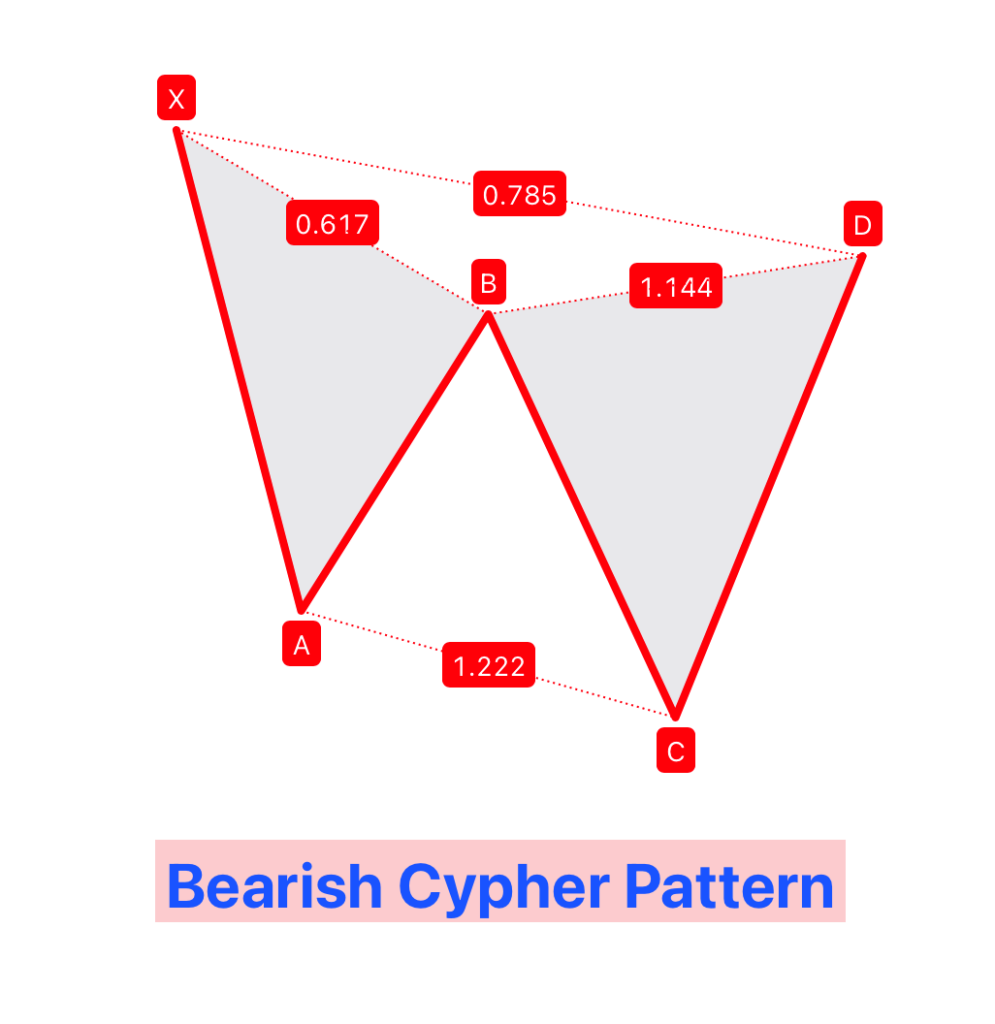
5. Cypher Pattern
Definition
The Cypher Pattern is a modern and less commonly known harmonic chart pattern, distinguished by its unique Fibonacci levels and structure. It has gained popularity for its effectiveness in identifying potential market reversals.
Signal
- Bullish Signal: In a downtrend, the pattern forms a distinct ‘W’ shape, signaling a potential upward market reversal.
- Bearish Signal: During an uptrend, it takes on an ‘M’ shape, indicating a potential downward reversal.
Fibonacci Ratios
- XA Leg: The starting leg of the pattern, with no specific Fibonacci ratio.
- AB Leg: Retraces to 38.2% – 61.8% of the XA leg, a key aspect differentiating the Cypher from other patterns.
- BC Leg: Retraces 113% – 141.4% of the AB leg, extending beyond the initial XA leg.
- CD Leg: Extends to 78.6% of the XC leg, completing the pattern.
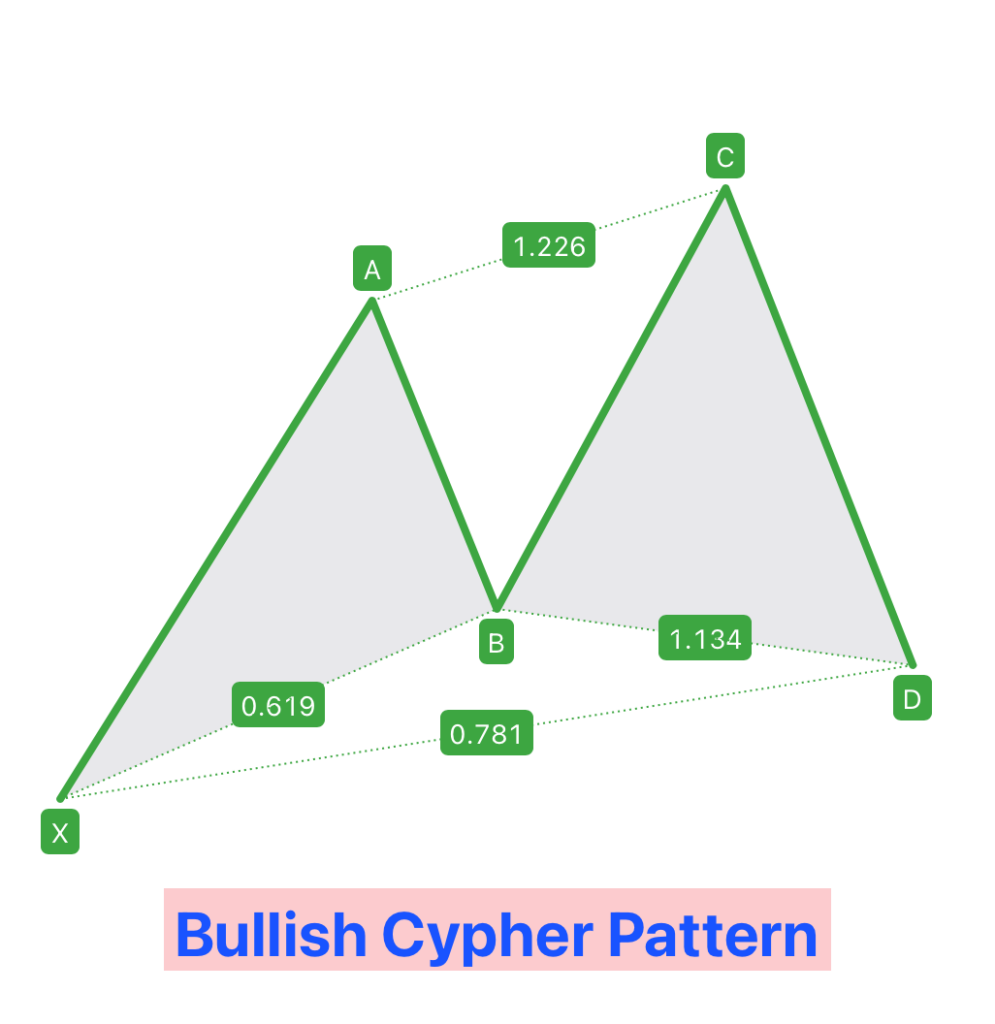
Trend
- The Cypher Pattern can be found in both bullish and bearish scenarios:
- In Bullish Trends: The pattern emerges at the end of downtrends, providing signals for potential bullish reversals.
- In Bearish Trends: It appears at the peak of uptrends, suggesting imminent bearish reversals.
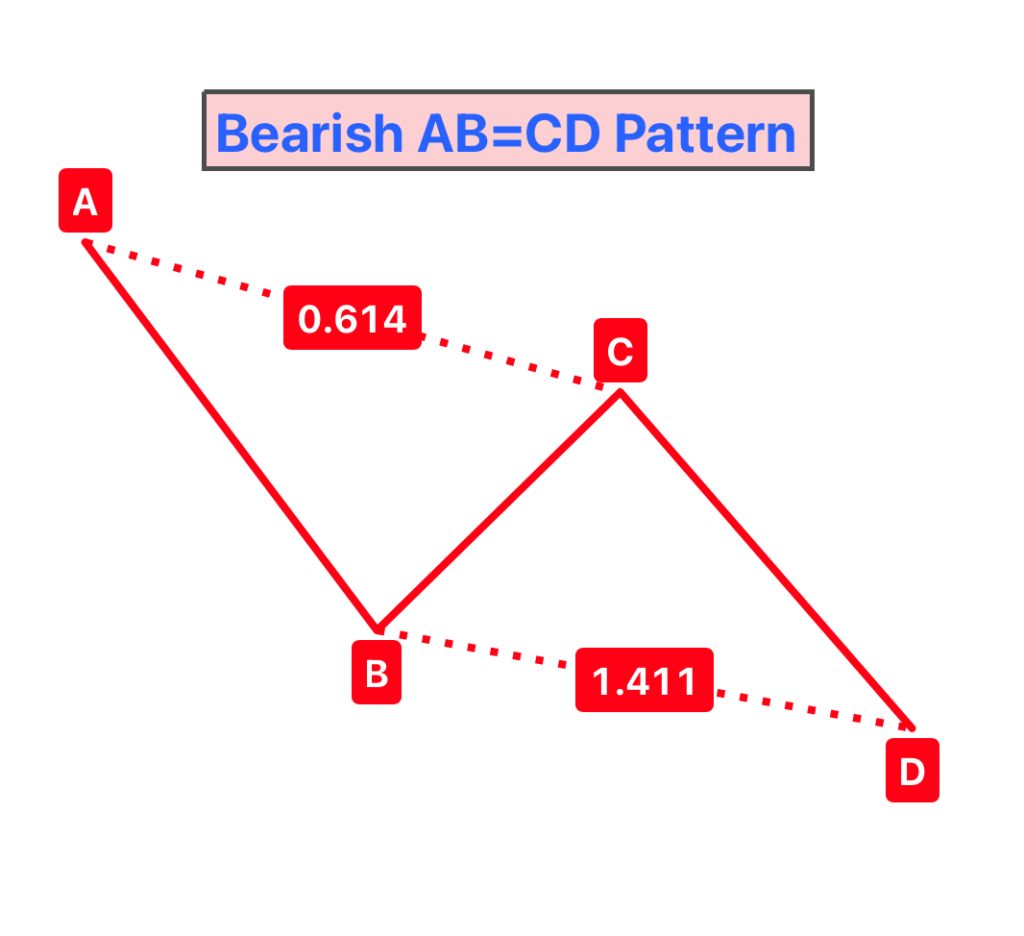
6. AB=CD Harmonic Pattern
Definition
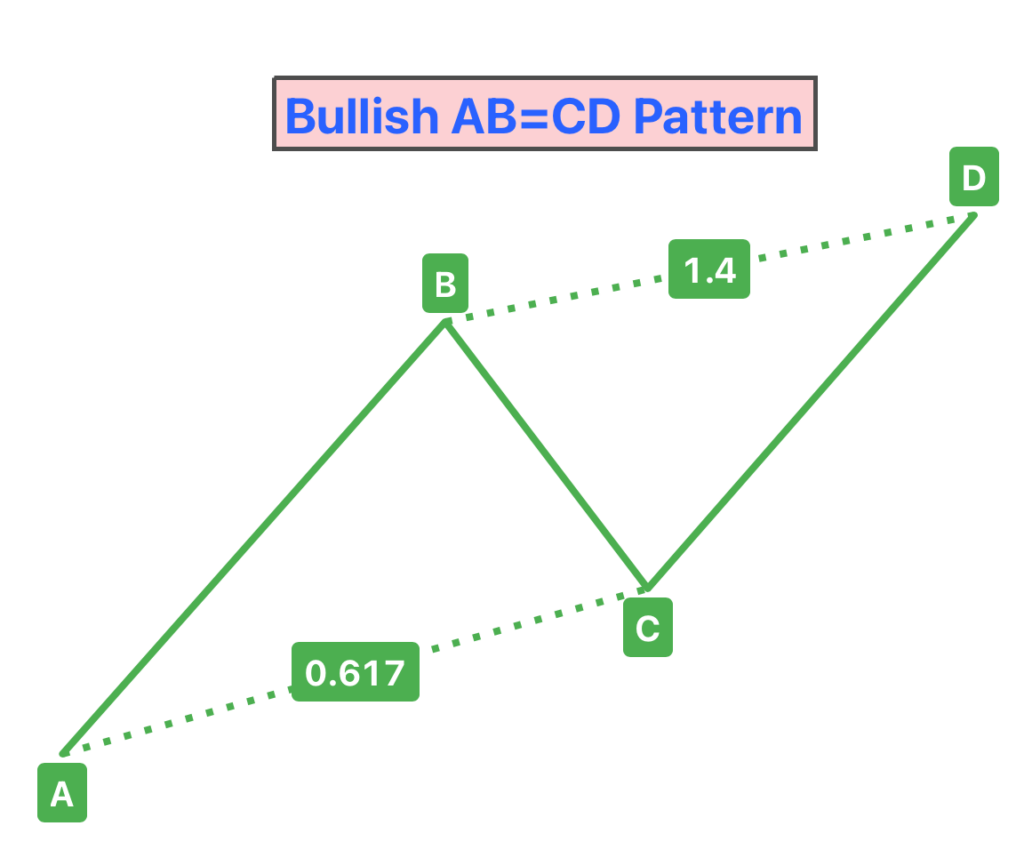
- The AB=CD Harmonic Pattern is a basic yet powerful structure in technical analysis, characterized by its simplicity and symmetry. It consists of two equivalent price legs, AB and CD, making it one of the most easily recognizable harmonic patterns.
Signal
- Bullish Signal: In a bullish AB=CD pattern, the CD leg mirrors the AB leg in length and slope, typically forming after a retracement. This pattern often suggests an upward continuation or reversal.
- Bearish Signal: In the bearish variant, the pattern appears inverted, with the CD leg mirroring the AB leg downward, indicating a potential continuation or reversal to the downside.
Fibonacci Ratios
- AB and CD Legs: These legs are of equal length. The CD leg usually retraces 127.2% to 161.8% of the BC leg.
- BC Leg: This leg often retraces to 61.8% of the AB leg. The symmetry between the AB and CD legs is a key feature.
Trend
- The AB=CD Pattern can be observed in both bullish and bearish market trends:
- In Bullish Trends: The pattern indicates a possible upward movement or reversal after the completion of the CD leg.
- In Bearish Trends: It suggests a downward movement or reversal upon completing the CD leg.
Common Mistakes to Avoid in Harmonic Trading
When trading with harmonic patterns, it’s important to avoid certain common mistakes to improve your trading success:
| Mistake | What It Means |
|---|---|
| Ignoring the Big Picture | Not looking at overall market trends and just focusing on patterns. |
| Wrong Fibonacci Use | Using Fibonacci levels incorrectly, leading to wrong pattern identification. |
| Forcing Patterns | Trying to find patterns that aren’t really there. |
| Not Managing Risk | Not setting stop-losses or ignoring how much you can afford to lose. |
| Jumping in Too Early | Entering trades before the pattern is fully formed. |
| Only Using Patterns | Relying solely on harmonic patterns without other trading tools for backup. |
| Being Impatient | Not waiting long enough for patterns to fully develop before making a move. |
Keeping these points in mind can help you make better trading decisions and avoid common pitfalls in harmonic trading.
Conclusion
To wrap up, harmonic patterns are really useful for traders. They help guess where the market might go next. But, it’s important to remember a few things:
- These patterns are just one part of your trading plan. You need to look at the whole market picture, not just the patterns.
- Make sure you’re using Fibonacci numbers the right way.
- Be patient and wait for the patterns to fully form before you make your move.
- Don’t just rely on these patterns alone. Use other tools and check the overall market trends too.
- And, always manage your risk. Know how much you can afford to lose and set your stop-loss orders to protect your money.
If you keep all this in mind, harmonic patterns can be a really helpful tool in your trading toolkit. They can give you an edge in making smart trading choices.

